Hourly Menu Analysis
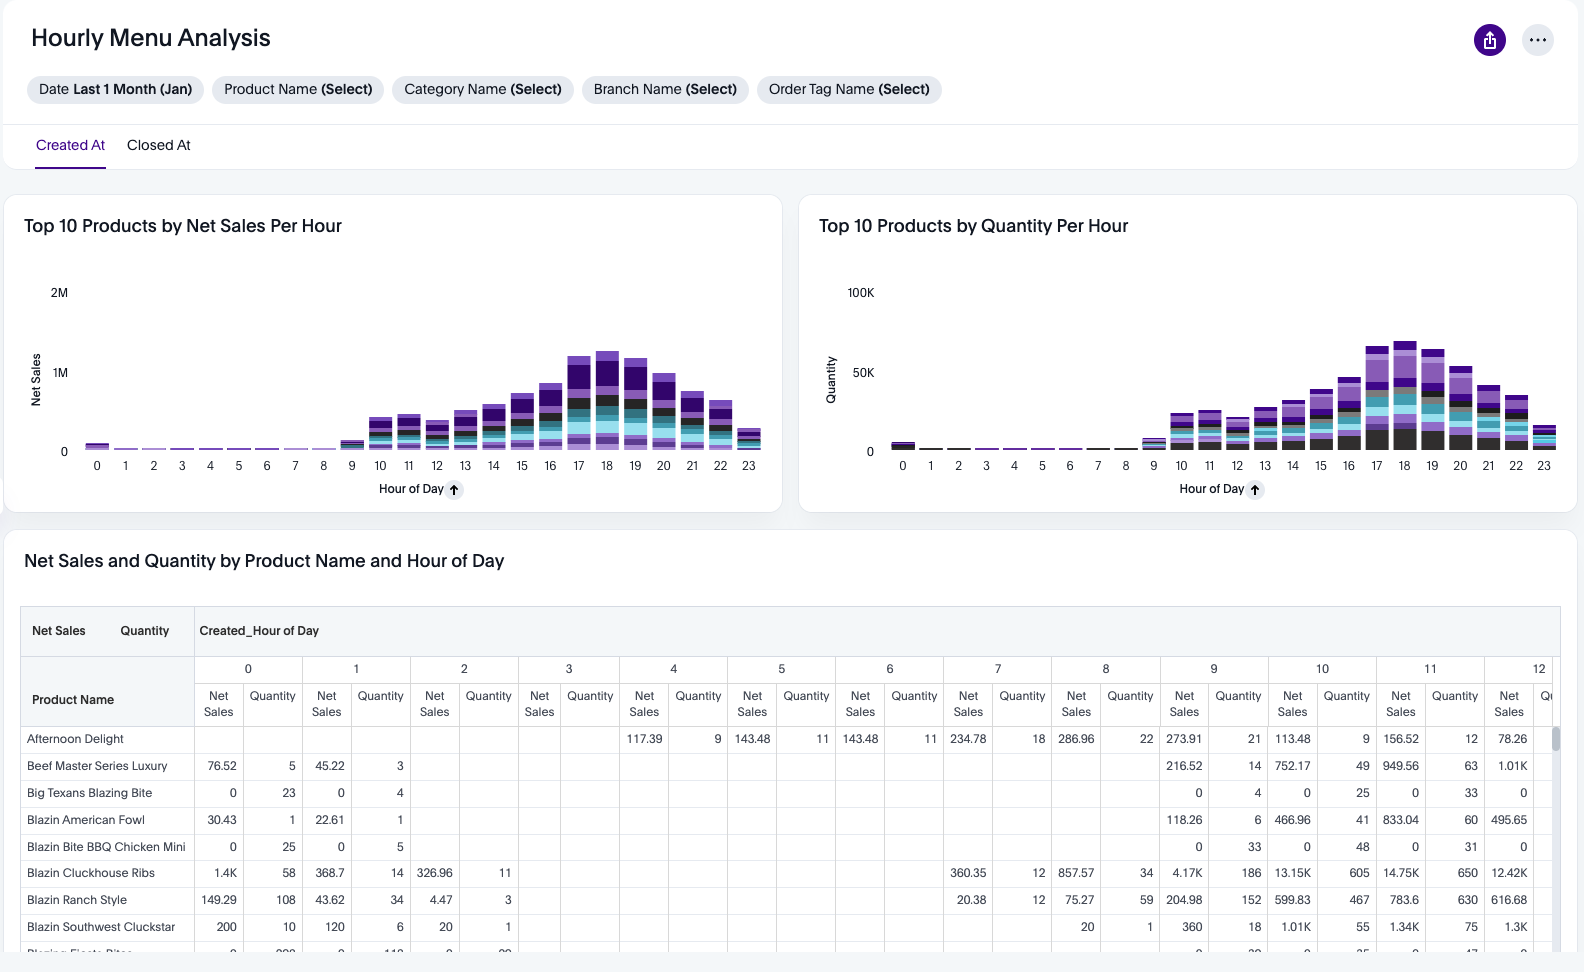
The Hourly Menu Analysis Liveboard evaluates the performance of your menu and its products per hour. It is split into two tabs: Created_at and Closed_at, depending on whether the creation time or closing time of orders is more relevant to your business.
Filters:
Date (default: last month)
Product Name
Category Name
Branch Name
Order Tag Name
Visualizations:
Top 10 Products by Net Sales per Hour (Bar Chart)
Top 10 Products by Quantity per Hour (Bar Chart)
Net Sales and Quantity per Hour of Day per Product (Pivot Table)
Net Sales and Quantity by Branch Name and Hour of Day (Pivot Table)